Pin Mapping
Pin Mapping. Create color-coded pin maps by incident date, location, offense type, or other attributes used within your database.
Single Symbol Maps. Similar to the wall maps and push pins that have historically been used by police agencies to map crime, single symbol maps use individual symbols to represent point features such as the locations of crime or traffic accidents, line features such as streets or pathways, and polygon features such as land parcels or police districts. Single symbol maps allow for a detailed analysis, and they are used quite frequently in law enforcement to depict incident locations for small amounts of data. A drawback to using single symbol mapping is that if two or more incidents share a geographic attribute such as the same address, subsequent symbols are placed on top of the original. Thus, it is difficult and time-consuming to determine if more than one incident is occurring at the same address. Additionally, maps of large data sets can become cluttered if too many features are added.
In this example, we show Robbery occurrences during the month of December 2011 within a one-mile radius of the intersection of Oracle and Wetmore in Tucson, AZ. You can see where the crimes took place but not the number of crimes at a specific location or when during the year the crime occurred.
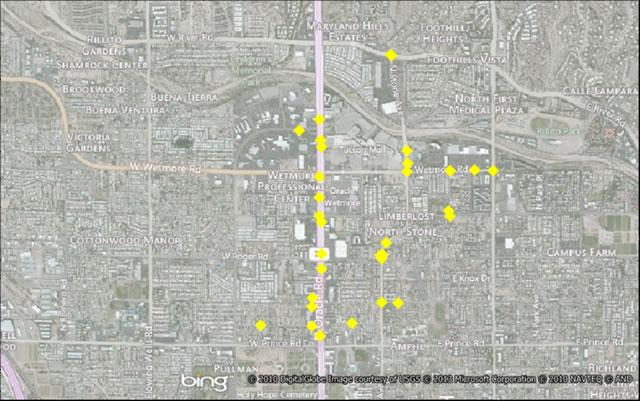
These maps focus on location, so you could use them to see if Alcohol-related crime occurred near specific businesses, for example, bars.
Graduated Size Maps. In a graduated size map, data are summarized so that symbols (point or line features) are altered in size to reflect the frequencies in the data. A graduated size point map reflects more incidents at an individual location with a larger symbol. Graduated size maps are valuable for depicting multiple events of the same type at the same location, such as traffic accidents. However, it is difficult to use graduated size maps to depict different types of incidents, e.g. burglaries and thefts, as they too are placed directly on top of one another. In addition, graduated size maps become cluttered if a large number of incidents are mapped, and oftentimes, larger symbols may conceal smaller ones, depending on the map’s scale.
In this example, we show all crime occurrences during 2011 within a one-mile radius of the intersection of Oracle and Wetmore in Tucson, AZ. As you can see your eye is drawn to the areas of higher crime, however, you have no information on the type of crime that occurred or when the crime occurred.
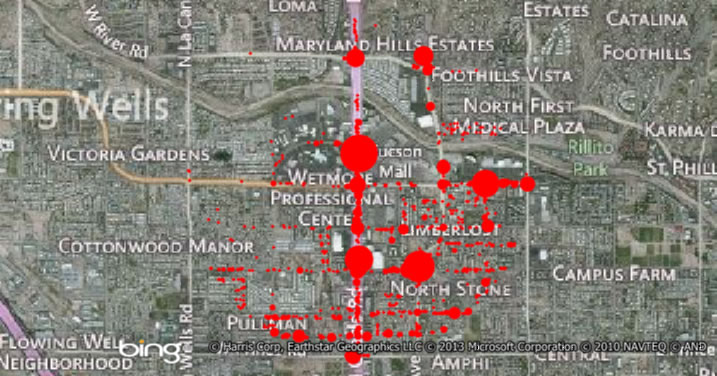
This type of crime map would be useful to see where more autos are stolen, or where do most burglaries occur.
Do you need Crime Analysis capabilities that are a step above the free web services?
GeoGRAFX provides analysis customized to meet our client's needs, whether it is weekly crime reporting for a shopping center, analysis and presentation materials for a court case, or providing support for security firms that need outside reporting that show that their services are effective.