Incident Mapping
Incident Count Mapping. Create color-coded maps using incident count information to represent attributes such as incident date, time, location, and offense type.
Since the distribution of incidents across geography is not random, the ability to delineate areas of abnormal frequency is essential to optimizing resources. Understanding where incidents occur and comparing locations with other factors – time, relative location to other geographic features, and offense statistics – help define problem areas.
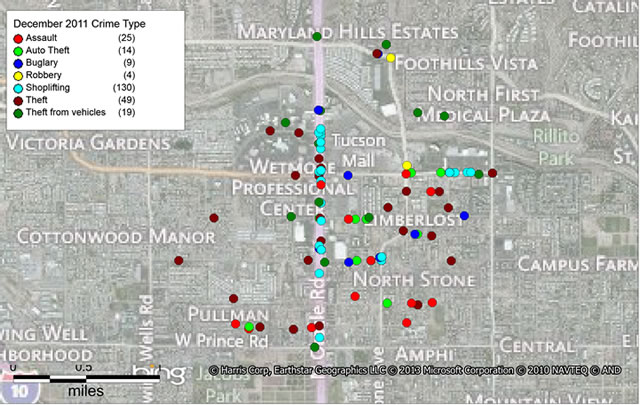
In this example, we’ve once again shown the Tucson crime data for the month of December 2011 within a one-mile radius of the intersection of Oracle and Wetmore in Tucson, AZ. You can identify the specific types of crimes but not the number of crimes at a specific location or when during the month the crime occurred. These maps would be good for showing crime distribution over a small area with not much overlap, so weekly crime reports would be an ideal use for incident count maps.
Do you need Crime Analysis capabilities that are a step above the free web services?
GeoGRAFX provides analysis customized to meet our client's needs, whether it is weekly crime reporting for a shopping center, analysis and presentation materials for a court case, or providing support for security firms that need outside reporting that show that their services are effective.