Hot Spot Mapping
Hot Spot Mapping. Automatically extract crime hot spots from incident maps to determine where police patrols should be directed.
The term hot spot has become part of the crime analysis lexicon and has received a lot of attention. Much of crime mapping is devoted to detecting high-crime density areas known as hot spots. Continuous surface hot spot maps allow for easier interpretation of crime clusters and reflect more accurately the location and spatial distribution of crime hot spots. Hot spot analysis can identify high-crime areas, types of crime being committed and the best way to respond.
In this example, we show the total crime for the year 2011 within a one-mile radius of the intersection of Oracle and Wetmore in Tucson, AZ. Areas with more crime are indicated by the warmer colors.
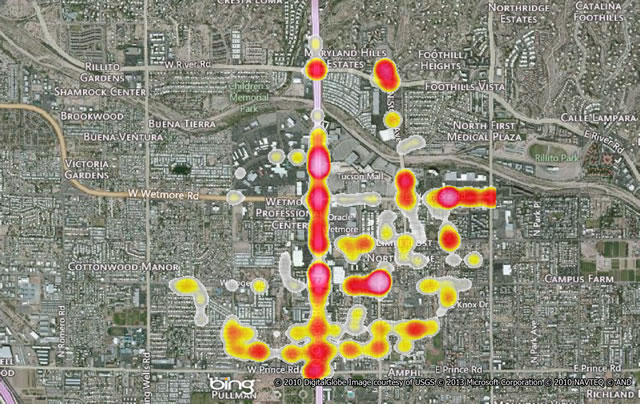
With this example, you can see that more crime is occurring in this area along the major roadways, and appear to be focused around shopping centers.
Do you need Crime Analysis capabilities that are a step above the free web services?
GeoGRAFX provides analysis customized to meet our client's needs, whether it is weekly crime reporting for a shopping center, analysis and presentation materials for a court case, or providing support for security firms that need outside reporting that show that their services are effective.